According to the China Customs Statistics, the total export amount of ceramic sanitary ware is about USD 4.16 billion (including HS Code: 691010 & 691090) in the first half year of 2021 (January to June 2021). It’s an increase of 32.66% comparing with customs export data from January to June in 2020. And it’s 47.5% of the total value in the whole year of 2020 (USD 8.756 billion).
Note:
HS Code 691010 usually means Ceramic sinks, washbasins, washbasin pedestals, baths, bidets, water closet bowls, flush tanks, urinals and similar sanitary fixtures of Porcelain or China.
HS Code 691090 usually means Ceramic sinks, washbasins, washbasin pedestals, baths, bidets, water closet bowls, flush tanks, urinals and similar sanitary fixtures of Other Materials.
- CONTENTS OF THIS ARTICLE:
- Part 1: China Export Official Data (Jan to Jun 2021)
- Part 2: Top 20 China Export Countries
- Part 3: Future Data Analysis (July to Dec 2021)
- Part 4: Overall China Export Data (Jan to Jun 2021)
—
PART 1: China Export Official Data (Jan to Jun 2021)
China Customs Export Statistics of Ceramic Sanitary Ware in Jan to Jun 2021
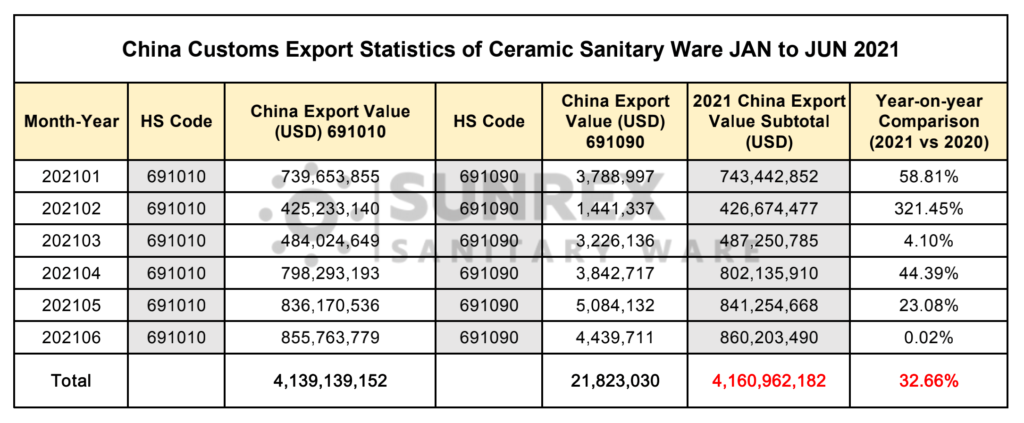
Comparing the customs data in 2021 and 2020, we could see the export data is growing steadily in 2021. Because of the Covid-19, the base in 2020 is low. And the increased overseas demand caused by the Covid-19 also promoted China’s exports to other countries.
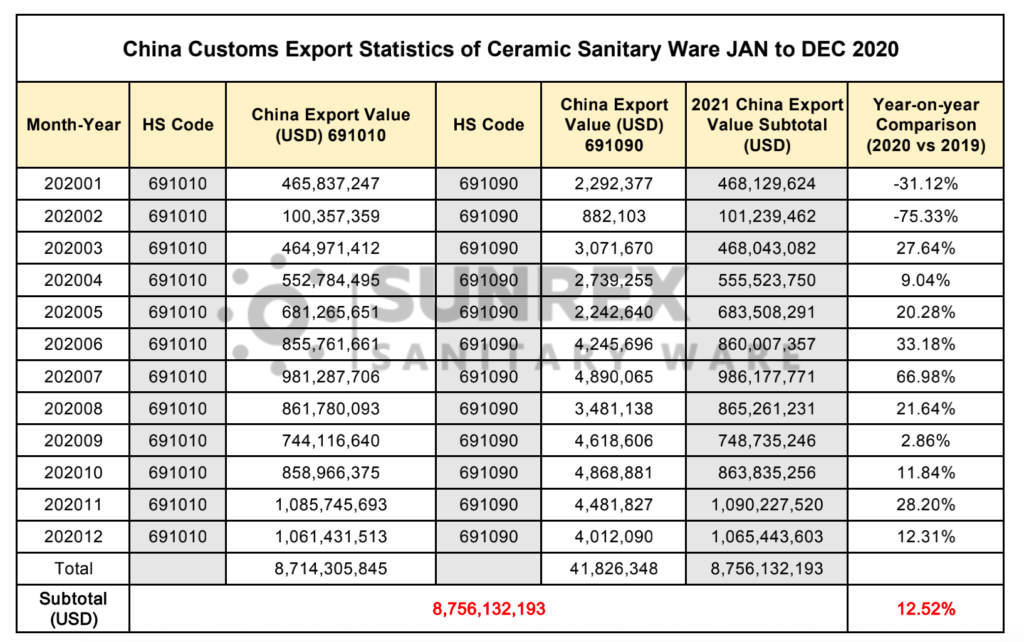
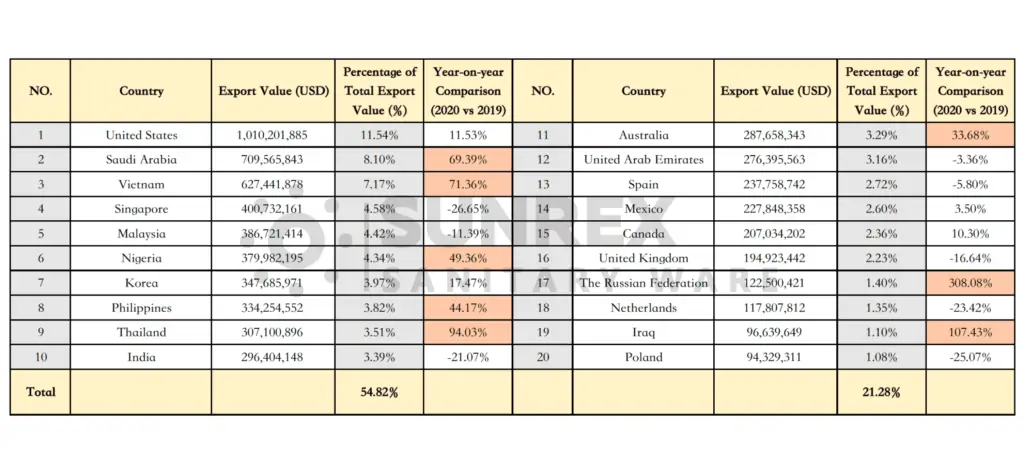
Appendix: China Customs Export Statistics of Ceramic Sanitary Ware in 2020
—
PART 2: Top 20 China Export Countries
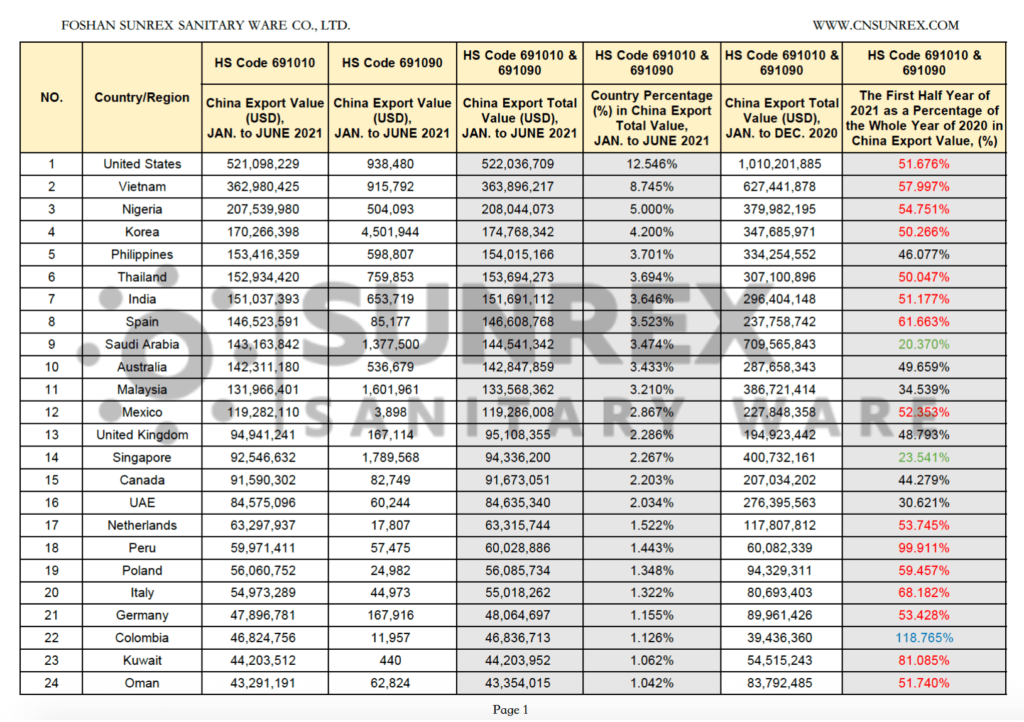
China’s Top 20 Exports of Ceramic Sanitary Ware in Jan to Jun 2021
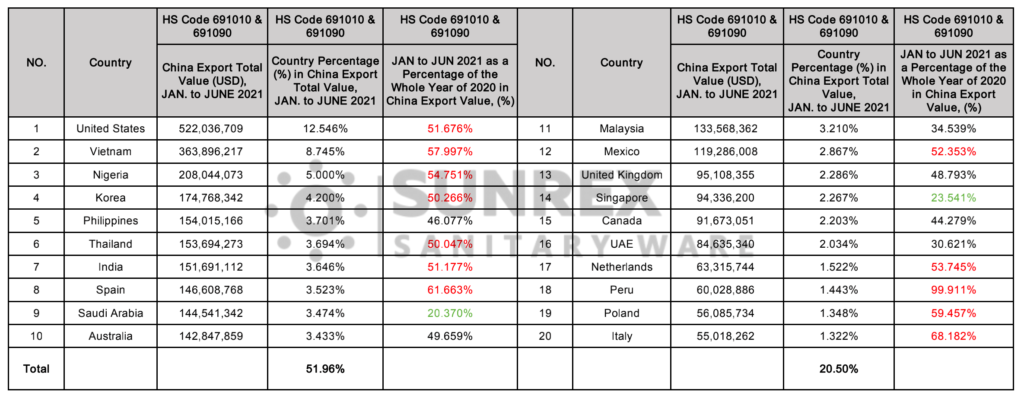
- The top 10 countries China export ceramic sanitary ware to are United States (12.546%), Vietnam (8.745%), Nigeria (5.000%), Korea (4.200%), Philippines (3.701%), Thailand (3.694%), India (3.646%), Spain (3.523%), Saudi Arabia (3.474%), and Australia (3.433%) from January to June 2020.
- From the ceramic sanitary ware customs export data from January to June 2021, we could see that these countries were increasing the purchasing demands from China, which includes Peru, Italy, Spain, Poland, Vietnam, Nigeria, etc. Whereas these countries were decreasing the purchasing comparing with 2020, e.g.: Saudi Arabia, Singapore, United Arab Emirates, Malaysia, etc.
Appendix: Top 20 Countries that China Export Ceramic Sanitary Ware in 2020
—
PART 3: Future Data Analysis (July to Dec 2021)
Although in the first half year of 2021, the China export data for ceramic sanitary ware in 110 countries or regions has reached 50% of their value in 2020, but the export situation in the second half year still face a lot of challenges and risks.
- . The Covid variants like Delta, Beta, Alpha, Gamma make a new round of outbreaks in some countries, which means the International sanitary ware market demand will be fluctuated by these. The Covid-19 epidemic is still the biggest uncertainty.
- The global vaccine supply is unbalanced, and the flow of goods and people across borders is still restricted. The influence will be effected on the international exhibitions, business visit abroad, face to face communication and understand deeper to avoid business risk, etc.
- International logistics capacity continues to be tight and freight rates are high. The high shipping freight has been compressing the profits of Chinese suppliers, international brands, importers, showrooms, and contractors. It also makes the Chinese sanitary ware suppliers receive payment slowly and increase business risks. These issues are not healthy for the whole industry to grow.
—
PART 4: Overall China Export Data (Jan to Jun 2021)
Attached table:
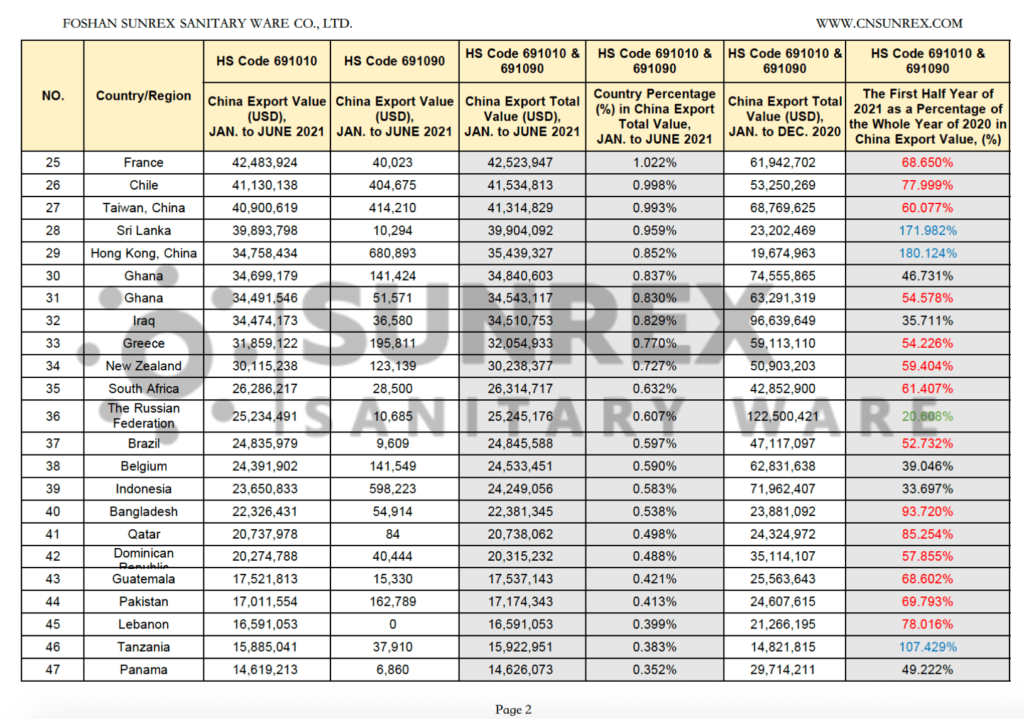
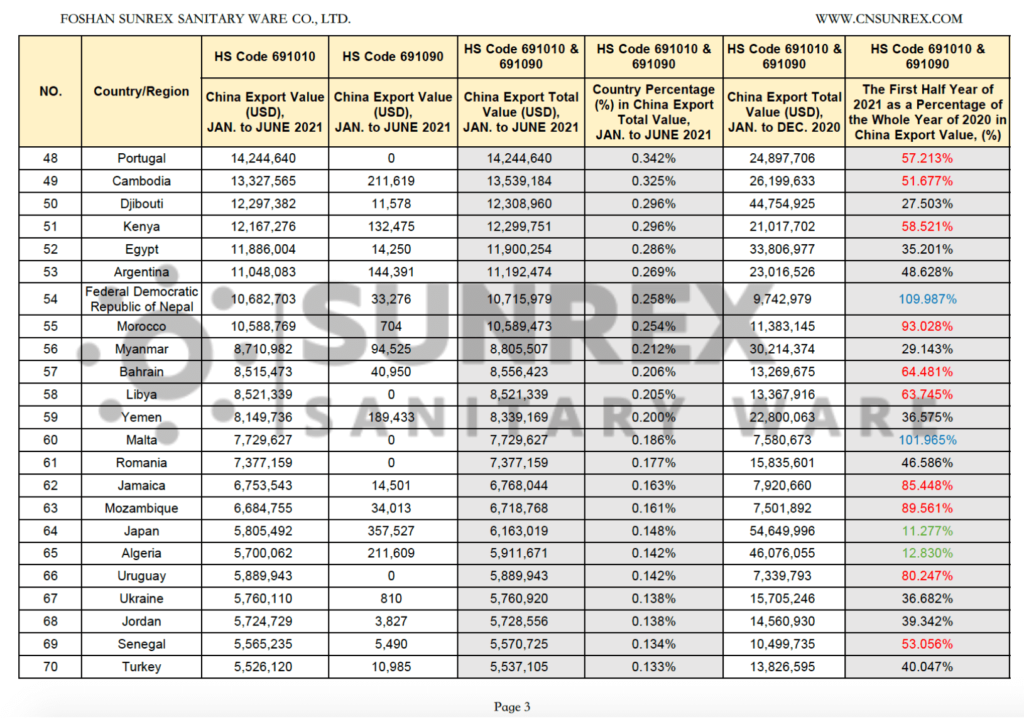
(Overall) China Customs Export Statistics of Ceramic Sanitary Ware from Jan to Jun 2021
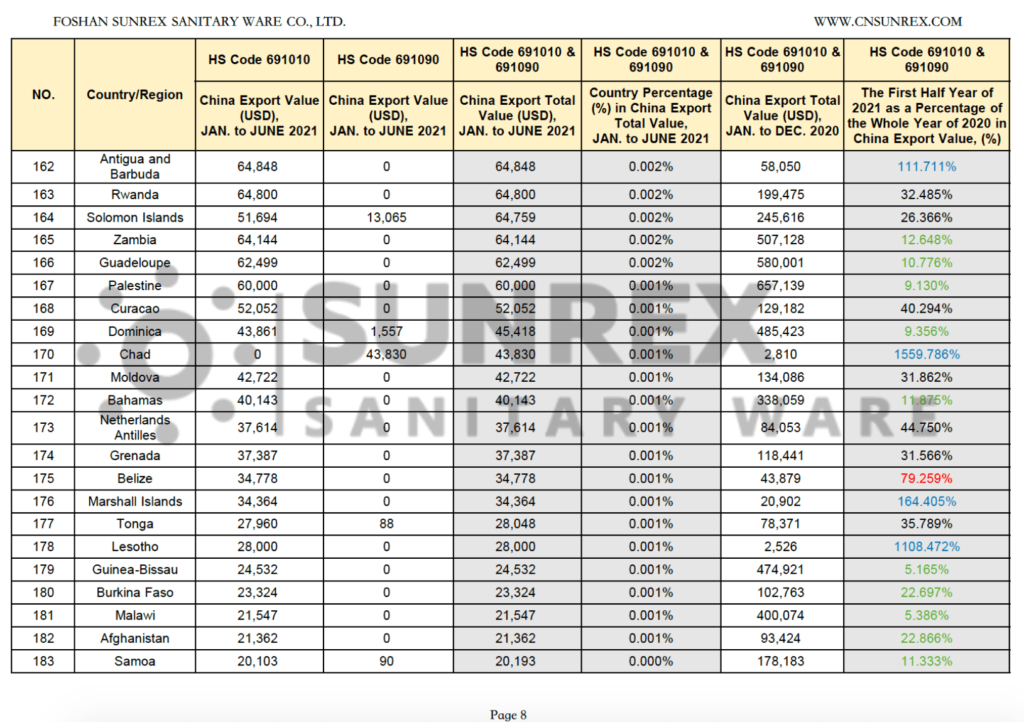
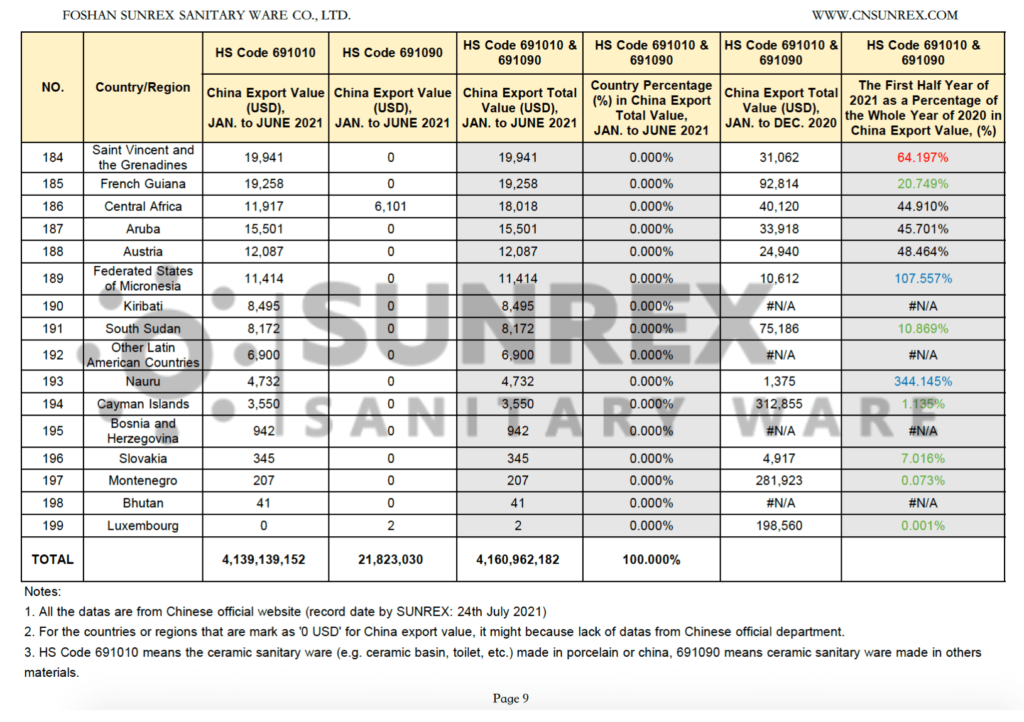
Notes:
1. All the data are from Chinese official website (record date by SUNREX: 24th July 2021)
2. For the countries or regions that are mark as ‘0 USD’ for China export value, it might because lack of data from the Chinese official department.
Fast Search Edition is as follows (Please press the Ctrl+F buttons on Windows, or Command+F buttons on Macbook, then enter your country/region name for fast search):
| NO. | Country/Region | HS Code 691010 | HS Code 691090 | HS Code 691010 & 691090 | HS Code 691010 & 691090 | HS Code 691010 & 691090 | HS Code 691010 & 691090 |
|---|---|---|---|---|---|---|---|
| China Export Value (USD), JAN. to JUNE 2021 | China Export Value (USD), JAN. to JUNE 2021 | China Export Total Value (USD), JAN. to JUNE 2021 | Country Percentage (%) in China Export Total Value, JAN. to JUNE 2021 | China Export Total Value (USD), JAN. to DEC. 2020 | The First Half Year of 2021 as a Percentage of the Whole Year of 2020 in China Export Value, (%) | ||
| 1 | United States | 521098229 | 938480 | 522036709 | 12.54606% | 1010201885 | 51.67647% |
| 2 | Vietnam | 362980425 | 915792 | 363896217 | 8.745482% | 627441878 | 57.9968% |
| 3 | Nigeria | 207539980 | 504093 | 208044073 | 4.999903% | 379982195 | 54.75101% |
| 4 | Korea | 170266398 | 4501944 | 174768342 | 4.200191% | 347685971 | 50.26615% |
| 5 | Philippines | 153416359 | 598807 | 154015166 | 3.701432% | 334254552 | 46.07721% |
| 6 | Thailand | 152934420 | 759853 | 153694273 | 3.69372% | 307100896 | 50.04683% |
| 7 | India | 151037393 | 653719 | 151691112 | 3.645578% | 296404148 | 51.17712% |
| 8 | Spain | 146523591 | 85177 | 146608768 | 3.523434% | 237758742 | 61.66283% |
| 9 | Saudi Arabia | 143163842 | 1377500 | 144541342 | 3.473748% | 709565843 | 20.37039% |
| 10 | Australia | 142311180 | 536679 | 142847859 | 3.433049% | 287658343 | 49.65886% |
| 11 | Malaysia | 131966401 | 1601961 | 133568362 | 3.210035% | 386721414 | 34.53865% |
| 12 | Mexico | 119282110 | 3898 | 119286008 | 2.866789% | 227848358 | 52.35324% |
| 13 | United Kingdom | 94941241 | 167114 | 95108355 | 2.28573% | 194923442 | 48.79267% |
| 14 | Singapore | 92546632 | 1789568 | 94336200 | 2.267173% | 400732161 | 23.54096% |
| 15 | Canada | 91590302 | 82749 | 91673051 | 2.20317% | 207034202 | 44.27918% |
| 16 | UAE | 84575096 | 60244 | 84635340 | 2.034033% | 276395563 | 30.62109% |
| 17 | Netherlands | 63297937 | 17807 | 63315744 | 1.521661% | 117807812 | 53.74495% |
| 18 | Peru | 59971411 | 57475 | 60028886 | 1.442668% | 60082339 | 99.91103% |
| 19 | Poland | 56060752 | 24982 | 56085734 | 1.347903% | 94329311 | 59.45738% |
| 20 | Italy | 54973289 | 44973 | 55018262 | 1.322249% | 80693403 | 68.18186% |
| 21 | Germany | 47896781 | 167916 | 48064697 | 1.155134% | 89961426 | 53.42812% |
| 22 | Colombia | 46824756 | 11957 | 46836713 | 1.125622% | 39436360 | 118.7653% |
| 23 | Kuwait | 44203512 | 440 | 44203952 | 1.062349% | 54515243 | 81.08549% |
| 24 | Oman | 43291191 | 62824 | 43354015 | 1.041923% | 83792485 | 51.73974% |
| 25 | France | 42483924 | 40023 | 42523947 | 1.021974% | 61942702 | 68.65046% |
| 26 | Chile | 41130138 | 404675 | 41534813 | 0.998202% | 53250269 | 77.99925% |
| 27 | Taiwan, China | 40900619 | 414210 | 41314829 | 0.992915% | 68769625 | 60.07715% |
| 28 | Sri Lanka | 39893798 | 10294 | 39904092 | 0.959011% | 23202469 | 171.9821% |
| 29 | Hong Kong, China | 34758434 | 680893 | 35439327 | 0.85171% | 19674963 | 180.124% |
| 30 | Ghana | 34699179 | 141424 | 34840603 | 0.837321% | 74555865 | 46.73087% |
| 31 | Ghana | 34491546 | 51571 | 34543117 | 0.830171% | 63291319 | 54.57797% |
| 32 | Iraq | 34474173 | 36580 | 34510753 | 0.829394% | 96639649 | 35.71076% |
| 33 | Greece | 31859122 | 195811 | 32054933 | 0.770373% | 59113110 | 54.22644% |
| 34 | New Zealand | 30115238 | 123139 | 30238377 | 0.726716% | 50903203 | 59.40368% |
| 35 | South Africa | 26286217 | 28500 | 26314717 | 0.632419% | 42852900 | 61.40709% |
| 36 | The Russian Federation | 25234491 | 10685 | 25245176 | 0.606715% | 122500421 | 20.60824% |
| 37 | Brazil | 24835979 | 9609 | 24845588 | 0.597112% | 47117097 | 52.73158% |
| 38 | Belgium | 24391902 | 141549 | 24533451 | 0.58961% | 62831638 | 39.04633% |
| 39 | Indonesia | 23650833 | 598223 | 24249056 | 0.582775% | 71962407 | 33.69684% |
| 40 | Bangladesh | 22326431 | 54914 | 22381345 | 0.537889% | 23881092 | 93.71994% |
| 41 | Qatar | 20737978 | 84 | 20738062 | 0.498396% | 24324972 | 85.25421% |
| 42 | Dominican Republic | 20274788 | 40444 | 20315232 | 0.488234% | 35114107 | 57.8549% |
| 43 | Guatemala | 17521813 | 15330 | 17537143 | 0.421468% | 25563643 | 68.60189% |
| 44 | Pakistan | 17011554 | 162789 | 17174343 | 0.412749% | 24607615 | 69.7928% |
| 45 | Lebanon | 16591053 | 0 | 16591053 | 0.398731% | 21266195 | 78.01609% |
| 46 | Tanzania | 15885041 | 37910 | 15922951 | 0.382675% | 14821815 | 107.4292% |
| 47 | Panama | 14619213 | 6860 | 14626073 | 0.351507% | 29714211 | 49.22248% |
| 48 | Portugal | 14244640 | 0 | 14244640 | 0.34234% | 24897706 | 57.21266% |
| 49 | Cambodia | 13327565 | 211619 | 13539184 | 0.325386% | 26199633 | 51.677% |
| 50 | Djibouti | 12297382 | 11578 | 12308960 | 0.29582% | 44754925 | 27.50303% |
| 51 | Kenya | 12167276 | 132475 | 12299751 | 0.295599% | 21017702 | 58.52091% |
| 52 | Egypt | 11886004 | 14250 | 11900254 | 0.285998% | 33806977 | 35.20059% |
| 53 | Argentina | 11048083 | 144391 | 11192474 | 0.268988% | 23016526 | 48.62799% |
| 54 | Federal Democratic Republic of Nepal | 10682703 | 33276 | 10715979 | 0.257536% | 9742979 | 109.9867% |
| 55 | Morocco | 10588769 | 704 | 10589473 | 0.254496% | 11383145 | 93.02766% |
| 56 | Myanmar | 8710982 | 94525 | 8805507 | 0.211622% | 30214374 | 29.14344% |
| 57 | Bahrain | 8515473 | 40950 | 8556423 | 0.205636% | 13269675 | 64.48103% |
| 58 | Libya | 8521339 | 0 | 8521339 | 0.204793% | 13367916 | 63.74471% |
| 59 | Yemen | 8149736 | 189433 | 8339169 | 0.200414% | 22800063 | 36.5752% |
| 60 | Malta | 7729627 | 0 | 7729627 | 0.185765% | 7580673 | 101.9649% |
| 61 | Romania | 7377159 | 0 | 7377159 | 0.177295% | 15835601 | 46.58591% |
| 62 | Jamaica | 6753543 | 14501 | 6768044 | 0.162656% | 7920660 | 85.44798% |
| 63 | Mozambique | 6684755 | 34013 | 6718768 | 0.161471% | 7501892 | 89.56098% |
| 64 | Japan | 5805492 | 357527 | 6163019 | 0.148115% | 54649996 | 11.27725% |
| 65 | Algeria | 5700062 | 211609 | 5911671 | 0.142075% | 46076055 | 12.83025% |
| 66 | Uruguay | 5889943 | 0 | 5889943 | 0.141552% | 7339793 | 80.24672% |
| 67 | Ukraine | 5760110 | 810 | 5760920 | 0.138452% | 15705246 | 36.6815% |
| 68 | Jordan | 5724729 | 3827 | 5728556 | 0.137674% | 14560930 | 39.34197% |
| 69 | Senegal | 5565235 | 5490 | 5570725 | 0.133881% | 10499735 | 53.05586% |
| 70 | Turkey | 5526120 | 10985 | 5537105 | 0.133073% | 13826595 | 40.04677% |
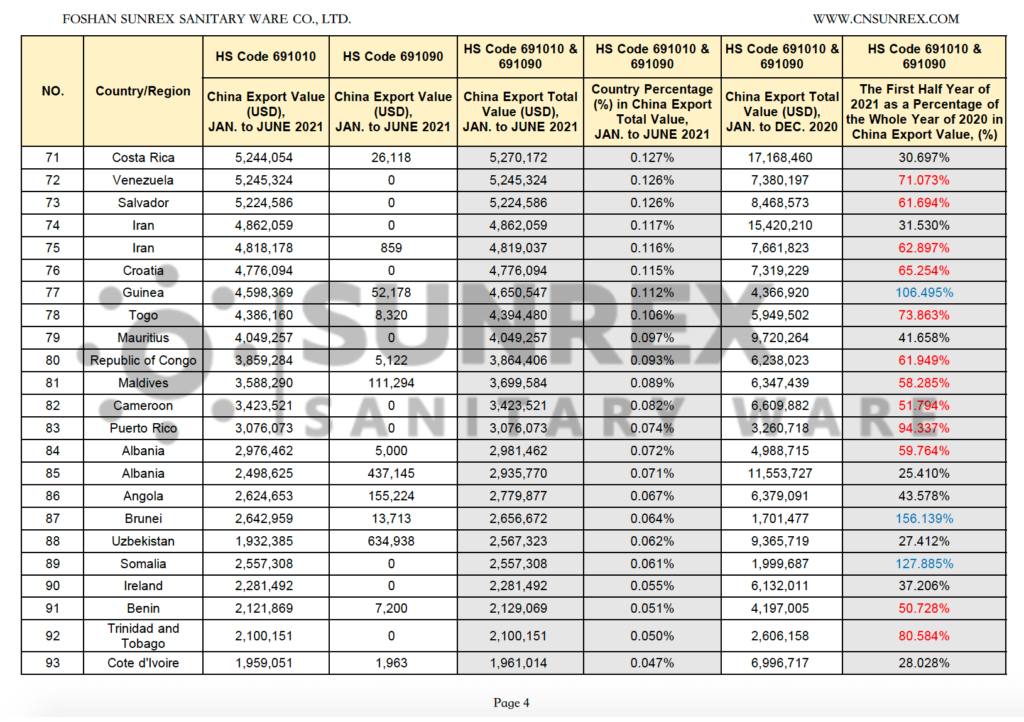
| 71 | Costa Rica | 5244054 | 26118 | 5270172 | 0.126658% | 17168460 | 30.69682% |
| 72 | Venezuela | 5245324 | 0 | 5245324 | 0.12606% | 7380197 | 71.07295% |
| 73 | Salvador | 5224586 | 0 | 5224586 | 0.125562% | 8468573 | 61.69382% |
| 74 | Iran | 4862059 | 0 | 4862059 | 0.116849% | 15420210 | 31.53043% |
| 75 | Iran | 4818178 | 859 | 4819037 | 0.115815% | 7661823 | 62.89674% |
| 76 | Croatia | 4776094 | 0 | 4776094 | 0.114783% | 7319229 | 65.25406% |
| 77 | Guinea | 4598369 | 52178 | 4650547 | 0.111766% | 4366920 | 106.4949% |
| 78 | Togo | 4386160 | 8320 | 4394480 | 0.105612% | 5949502 | 73.86299% |
| 79 | Mauritius | 4049257 | 0 | 4049257 | 0.097315% | 9720264 | 41.65789% |
| 80 | Republic of Congo | 3859284 | 5122 | 3864406 | 0.092873% | 6238023 | 61.94921% |
| 81 | Maldives | 3588290 | 111294 | 3699584 | 0.088912% | 6347439 | 58.28467% |
| 82 | Cameroon | 3423521 | 0 | 3423521 | 0.082277% | 6609882 | 51.79398% |
| 83 | Puerto Rico | 3076073 | 0 | 3076073 | 0.073927% | 3260718 | 94.33729% |
| 84 | Albania | 2976462 | 5000 | 2981462 | 0.071653% | 4988715 | 59.76413% |
| 85 | Albania | 2498625 | 437145 | 2935770 | 0.070555% | 11553727 | 25.40972% |
| 86 | Angola | 2624653 | 155224 | 2779877 | 0.066809% | 6379091 | 43.57795% |
| 87 | Brunei | 2642959 | 13713 | 2656672 | 0.063848% | 1701477 | 156.1392% |
| 88 | Uzbekistan | 1932385 | 634938 | 2567323 | 0.0617% | 9365719 | 27.41192% |
| 89 | Somalia | 2557308 | 0 | 2557308 | 0.06146% | 1999687 | 127.8854% |
| 90 | Ireland | 2281492 | 0 | 2281492 | 0.054831% | 6132011 | 37.20626% |
| 91 | Benin | 2121869 | 7200 | 2129069 | 0.051168% | 4197005 | 50.72829% |
| 92 | Trinidad and Tobago | 2100151 | 0 | 2100151 | 0.050473% | 2606158 | 80.58418% |
| 93 | Cote d'Ivoire | 1959051 | 1963 | 1961014 | 0.047129% | 6996717 | 28.02763% |
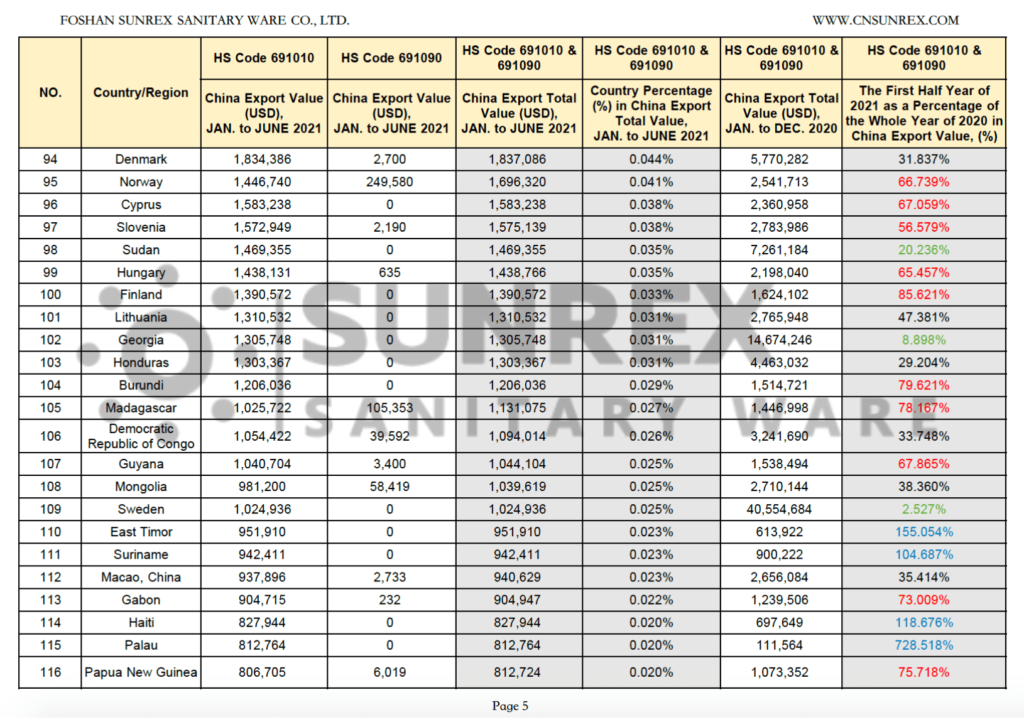
| 94 | Denmark | 1834386 | 2700 | 1837086 | 0.044151% | 5770282 | 31.83702% |
| 95 | Norway | 1446740 | 249580 | 1696320 | 0.040767% | 2541713 | 66.73924% |
| 96 | Cyprus | 1583238 | 0 | 1583238 | 0.03805% | 2360958 | 67.05913% |
| 97 | Slovenia | 1572949 | 2190 | 1575139 | 0.037855% | 2783986 | 56.57855% |
| 98 | Sudan | 1469355 | 0 | 1469355 | 0.035313% | 7261184 | 20.23575% |
| 99 | Hungary | 1438131 | 635 | 1438766 | 0.034578% | 2198040 | 65.45677% |
| 100 | Finland | 1390572 | 0 | 1390572 | 0.033419% | 1624102 | 85.62098% |
| 101 | Lithuania | 1310532 | 0 | 1310532 | 0.031496% | 2765948 | 47.38093% |
| 102 | Georgia | 1305748 | 0 | 1305748 | 0.031381% | 14674246 | 8.898229% |
| 103 | Honduras | 1303367 | 0 | 1303367 | 0.031324% | 4463032 | 29.20362% |
| 104 | Burundi | 1206036 | 0 | 1206036 | 0.028985% | 1514721 | 79.621% |
| 105 | Madagascar | 1025722 | 105353 | 1131075 | 0.027183% | 1446998 | 78.16701% |
| 106 | Democratic Republic of Congo | 1054422 | 39592 | 1094014 | 0.026292% | 3241690 | 33.74826% |
| 107 | Guyana | 1040704 | 3400 | 1044104 | 0.025093% | 1538494 | 67.86533% |
| 108 | Mongolia | 981200 | 58419 | 1039619 | 0.024985% | 2710144 | 38.36029% |
| 109 | Sweden | 1024936 | 0 | 1024936 | 0.024632% | 40554684 | 2.527294% |
| 110 | East Timor | 951910 | 0 | 951910 | 0.022877% | 613922 | 155.0539% |
| 111 | Suriname | 942411 | 0 | 942411 | 0.022649% | 900222 | 104.6865% |
| 112 | Macao, China | 937896 | 2733 | 940629 | 0.022606% | 2656084 | 35.41413% |
| 113 | Gabon | 904715 | 232 | 904947 | 0.021749% | 1239506 | 73.00868% |
| 114 | Haiti | 827944 | 0 | 827944 | 0.019898% | 697649 | 118.6763% |
| 115 | Palau | 812764 | 0 | 812764 | 0.019533% | 111564 | 728.5182% |
| 116 | Papua New Guinea | 806705 | 6019 | 812724 | 0.019532% | 1073352 | 75.71831% |
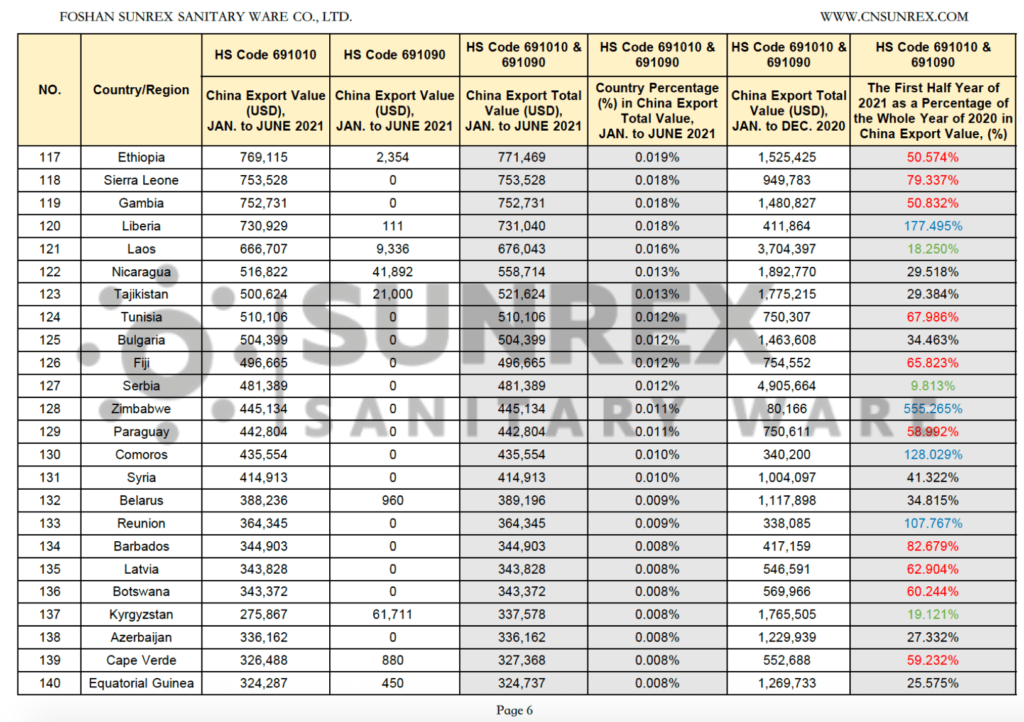
| 117 | Ethiopia | 769115 | 2354 | 771469 | 0.018541% | 1525425 | 50.57404% |
| 118 | Sierra Leone | 753528 | 0 | 753528 | 0.018109% | 949783 | 79.33686% |
| 119 | Gambia | 752731 | 0 | 752731 | 0.01809% | 1480827 | 50.8318% |
| 120 | Liberia | 730929 | 111 | 731040 | 0.017569% | 411864 | 177.4955% |
| 121 | Laos | 666707 | 9336 | 676043 | 0.016247% | 3704397 | 18.24974% |
| 122 | Nicaragua | 516822 | 41892 | 558714 | 0.013428% | 1892770 | 29.51832% |
| 123 | Tajikistan | 500624 | 21000 | 521624 | 0.012536% | 1775215 | 29.38371% |
| 124 | Tunisia | 510106 | 0 | 510106 | 0.012259% | 750307 | 67.9863% |
| 125 | Bulgaria | 504399 | 0 | 504399 | 0.012122% | 1463608 | 34.46271% |
| 126 | Fiji | 496665 | 0 | 496665 | 0.011936% | 754552 | 65.8225% |
| 127 | Serbia | 481389 | 0 | 481389 | 0.011569% | 4905664 | 9.812922% |
| 128 | Zimbabwe | 445134 | 0 | 445134 | 0.010698% | 80166 | 555.2653% |
| 129 | Paraguay | 442804 | 0 | 442804 | 0.010642% | 750611 | 58.99247% |
| 130 | Comoros | 435554 | 0 | 435554 | 0.010468% | 340200 | 128.0288% |
| 131 | Syria | 414913 | 0 | 414913 | 0.009972% | 1004097 | 41.322% |
| 132 | Belarus | 388236 | 960 | 389196 | 0.009354% | 1117898 | 34.81498% |
| 133 | Reunion | 364345 | 0 | 364345 | 0.008756% | 338085 | 107.7673% |
| 134 | Barbados | 344903 | 0 | 344903 | 0.008289% | 417159 | 82.67903% |
| 135 | Latvia | 343828 | 0 | 343828 | 0.008263% | 546591 | 62.90407% |
| 136 | Botswana | 343372 | 0 | 343372 | 0.008252% | 569966 | 60.2443% |
| 137 | Kyrgyzstan | 275867 | 61711 | 337578 | 0.008113% | 1765505 | 19.12076% |
| 138 | Azerbaijan | 336162 | 0 | 336162 | 0.008079% | 1229939 | 27.3316% |
| 139 | Cape Verde | 326488 | 880 | 327368 | 0.007868% | 552688 | 59.23197% |
| 140 | Equatorial Guinea | 324287 | 450 | 324737 | 0.007804% | 1269733 | 25.57522% |
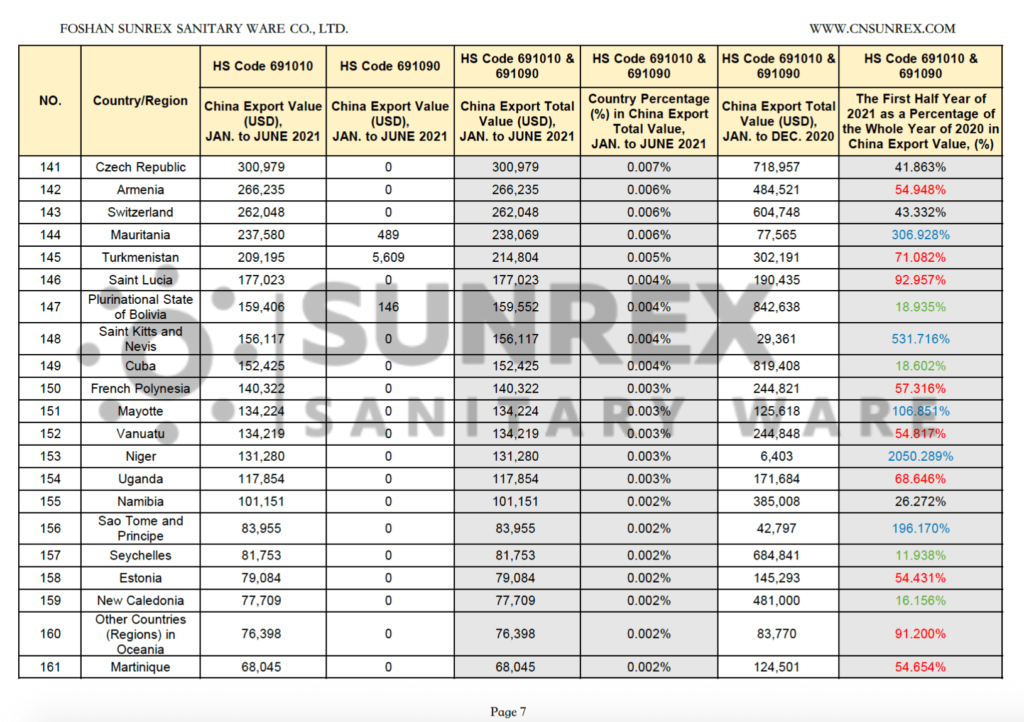
| 141 | Czech Republic | 300979 | 0 | 300979 | 0.007233% | 718957 | 41.86328% |
| 142 | Armenia | 266235 | 0 | 266235 | 0.006398% | 484521 | 54.94808% |
| 143 | Switzerland | 262048 | 0 | 262048 | 0.006298% | 604748 | 43.33177% |
| 144 | Mauritania | 237580 | 489 | 238069 | 0.005721% | 77565 | 306.9284% |
| 145 | Turkmenistan | 209195 | 5609 | 214804 | 0.005162% | 302191 | 71.0822% |
| 146 | Saint Lucia | 177023 | 0 | 177023 | 0.004254% | 190435 | 92.95718% |
| 147 | Plurinational State of Bolivia | 159406 | 146 | 159552 | 0.003834% | 842638 | 18.93482% |
| 148 | Saint Kitts and Nevis | 156117 | 0 | 156117 | 0.003752% | 29361 | 531.7155% |
| 149 | Cuba | 152425 | 0 | 152425 | 0.003663% | 819408 | 18.60184% |
| 150 | French Polynesia | 140322 | 0 | 140322 | 0.003372% | 244821 | 57.31616% |
| 151 | Mayotte | 134224 | 0 | 134224 | 0.003226% | 125618 | 106.8509% |
| 152 | Vanuatu | 134219 | 0 | 134219 | 0.003226% | 244848 | 54.81727% |
| 153 | Niger | 131280 | 0 | 131280 | 0.003155% | 6403 | 2050.289% |
| 154 | Uganda | 117854 | 0 | 117854 | 0.002832% | 171684 | 68.64588% |
| 155 | Namibia | 101151 | 0 | 101151 | 0.002431% | 385008 | 26.27244% |
| 156 | Sao Tome and Principe | 83955 | 0 | 83955 | 0.002018% | 42797 | 196.1703% |
| 157 | Seychelles | 81753 | 0 | 81753 | 0.001965% | 684841 | 11.93752% |
| 158 | Estonia | 79084 | 0 | 79084 | 0.001901% | 145293 | 54.4307% |
| 159 | New Caledonia | 77709 | 0 | 77709 | 0.001868% | 481000 | 16.15572% |
| 160 | Other Countries (Regions) in Oceania | 76398 | 0 | 76398 | 0.001836% | 83770 | 91.19971% |
| 161 | Martinique | 68045 | 0 | 68045 | 0.001635% | 124501 | 54.65418% |
| 162 | Antigua and Barbuda | 64848 | 0 | 64848 | 0.001558% | 58050 | 111.7106% |
| 163 | Rwanda | 64800 | 0 | 64800 | 0.001557% | 199475 | 32.48527% |
| 164 | Solomon Islands | 51694 | 13065 | 64759 | 0.001556% | 245616 | 26.36595% |
| 165 | Zambia | 64144 | 0 | 64144 | 0.001542% | 507128 | 12.64848% |
| 166 | Guadeloupe | 62499 | 0 | 62499 | 0.001502% | 580001 | 10.77567% |
| 167 | Palestine | 60000 | 0 | 60000 | 0.001442% | 657139 | 9.130488% |
| 168 | Curacao | 52052 | 0 | 52052 | 0.001251% | 129182 | 40.29354% |
| 169 | Dominica | 43861 | 1557 | 45418 | 0.001092% | 485423 | 9.356376% |
| 170 | Chad | 0 | 43830 | 43830 | 0.001053% | 2810 | 1559.786% |
| 171 | Moldova | 42722 | 0 | 42722 | 0.001027% | 134086 | 31.86164% |
| 172 | Bahamas | 40143 | 0 | 40143 | 0.000965% | 338059 | 11.87455% |
| 173 | Netherlands Antilles | 37614 | 0 | 37614 | 0.000904% | 84053 | 44.75034% |
| 174 | Grenada | 37387 | 0 | 37387 | 0.000899% | 118441 | 31.56593% |
| 175 | Belize | 34778 | 0 | 34778 | 0.000836% | 43879 | 79.25887% |
| 176 | Marshall Islands | 34364 | 0 | 34364 | 0.000826% | 20902 | 164.4053% |
| 177 | Tonga | 27960 | 88 | 28048 | 0.000674% | 78371 | 35.78875% |
| 178 | Lesotho | 28000 | 0 | 28000 | 0.000673% | 2526 | 1108.472% |
| 179 | Guinea-Bissau | 24532 | 0 | 24532 | 0.00059% | 474921 | 5.165491% |
| 180 | Burkina Faso | 23324 | 0 | 23324 | 0.000561% | 102763 | 22.69689% |
| 181 | Malawi | 21547 | 0 | 21547 | 0.000518% | 400074 | 5.385754% |
| 182 | Afghanistan | 21362 | 0 | 21362 | 0.000513% | 93424 | 22.86564% |
| 183 | Samoa | 20103 | 90 | 20193 | 0.000485% | 178183 | 11.33273% |
| 184 | Saint Vincent and the Grenadines | 19941 | 0 | 19941 | 0.000479% | 31062 | 64.19741% |
| 185 | French Guiana | 19258 | 0 | 19258 | 0.000463% | 92814 | 20.74902% |
| 186 | Central Africa | 11917 | 6101 | 18018 | 0.000433% | 40120 | 44.91027% |
| 187 | Aruba | 15501 | 0 | 15501 | 0.000373% | 33918 | 45.7014% |
| 188 | Austria | 12087 | 0 | 12087 | 0.00029% | 24940 | 48.46431% |
| 189 | Federated States of Micronesia | 11414 | 0 | 11414 | 0.000274% | 10612 | 107.5575% |
| 190 | Kiribati | 8495 | 0 | 8495 | 0.000204% | #N/A | #N/A |
| 191 | South Sudan | 8172 | 0 | 8172 | 0.000196% | 75186 | 10.86904% |
| 192 | Other Latin American Countries (Regions) | 6900 | 0 | 6900 | 0.000166% | #N/A | #N/A |
| 193 | Nauru | 4732 | 0 | 4732 | 0.000114% | 1375 | 344.1455% |
| 194 | Cayman Islands | 3550 | 0 | 3550 | 0.000% | 312855 | 1.134711% |
| 195 | Bosnia and Herzegovina | 942 | 0 | 942 | 0.000% | #N/A | #N/A |
| 196 | Slovakia | 345 | 0 | 345 | 0.000% | 4917 | 7.016473% |
| 197 | Montenegro | 207 | 0 | 207 | 0.000% | 281923 | 0.073424% |
| 198 | Bhutan | 41 | 0 | 41 | 0.000% | #N/A | #N/A |
| 199 | Luxembourg | 0 | 2 | 2 | 0.000% | 198560 | 0.001007% |
| TOTAL | 4139139152 | 21823030 | 4160962182 | 100.00% | |||
| Notes: | |||||||
| 1. All the datas are from Chinese official website (record date by SUNREX: 24th July 2021) | |||||||
| 2. For the countries or regions that are mark as '0 USD' for China export value, it might because lack of datas from Chinese official department. | |||||||
| 3. HS Code 691010 means the ceramic sanitary ware (e.g. ceramic basin, toilet, etc.) made in porcelain or china, 691090 means ceramic sanitary ware made in others materials. |
|||||||
Copyright by FOSHAN SUNREX SANITARY WARE CO., LTD.
This article is origin in the web:
This is the end of this article, thanks for your reading.
For more helpful information, please visit: https://www.cnsunrex.com/blog/

